
Browse Guides
5 guides
3 guides
2 guides
13 guides
1 guide
9 guides
12 guides
2 guides
18 guides
1 guide
1 guide
1 guide
2 guides
1 guide
1 guide
1 guide
1 guide
1 guide
1 guide
1 guide
2 guides
2 guides
1 guide
AI Dashboard Builder
Use AI Dashboard Builder to add widgets, change layout, and update the dashboard from a plain-language request.
Use AI Dashboard Builder when you want to build or change a dashboard in plain language instead of doing each step manually.
You can use it to add a single widget, create a comparison view, reorganize the layout, or update the whole dashboard.
Open AI Dashboard Builder
- Open a channel.
- Click the Dashboards tab.
- Open the dashboard you want to update, or create a new dashboard first.
- Open the AI Assistance panel on the right side of the dashboard.
- Use the Build tab when you want AI to create or change the dashboard.
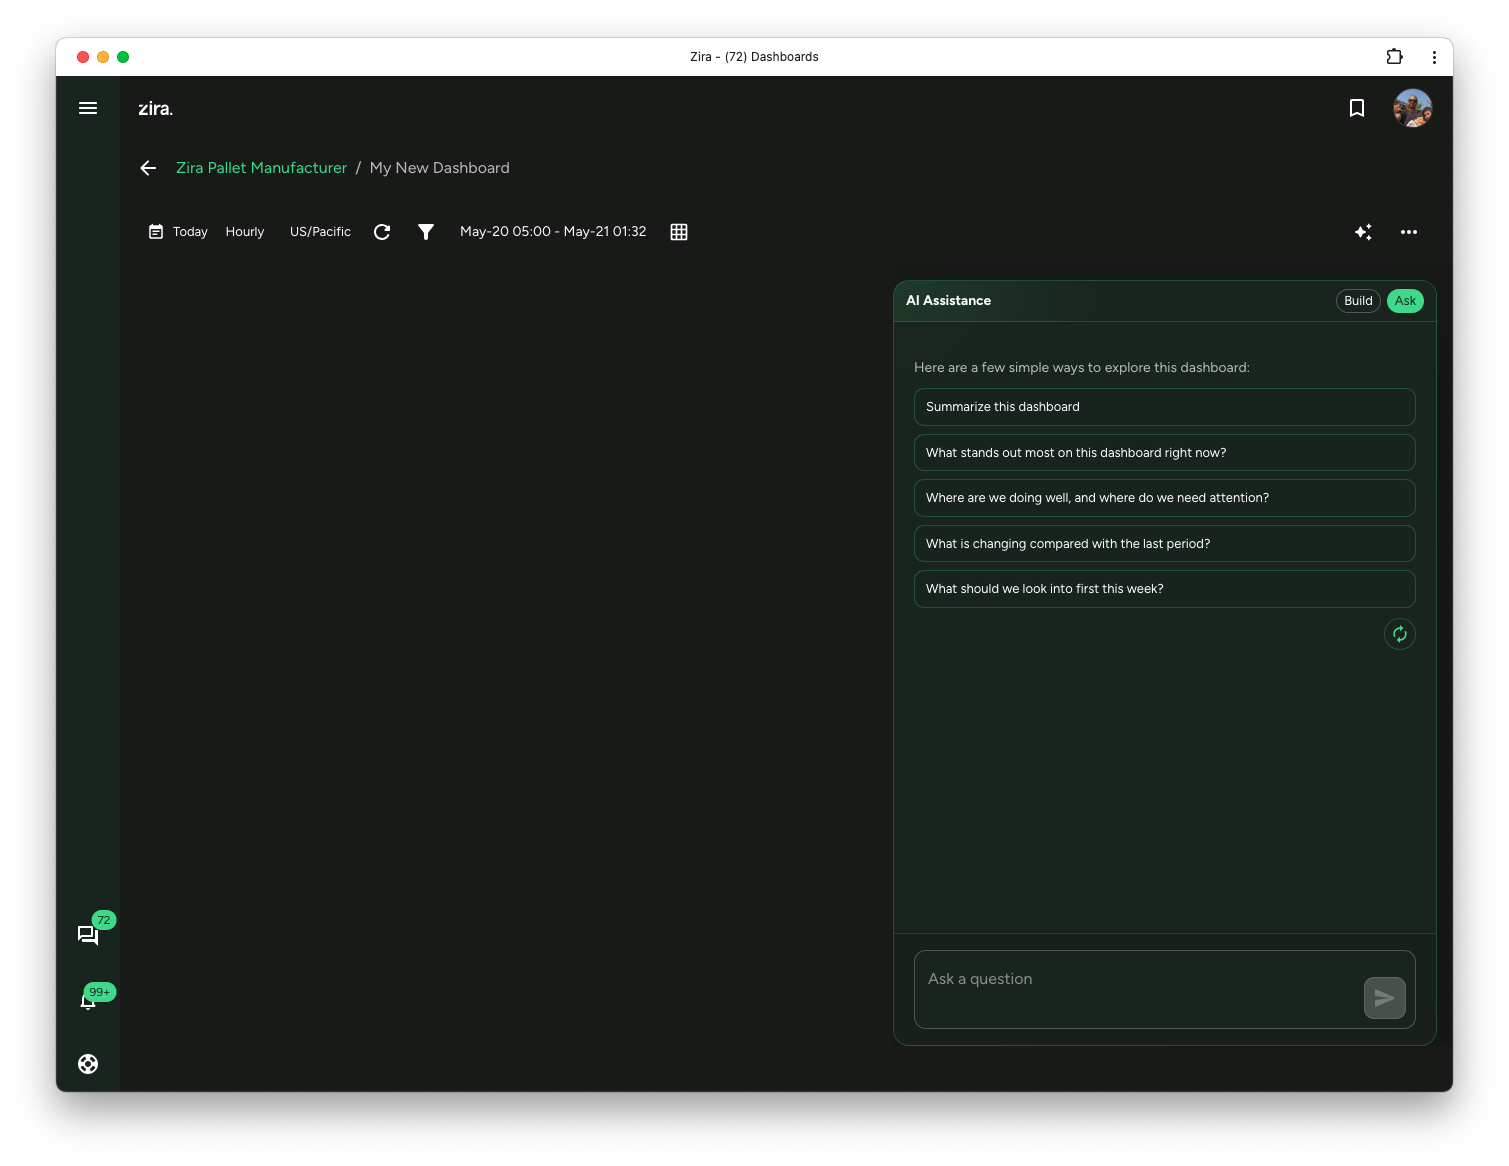
Start with a suggestion or your own request
The Build tab can suggest common dashboard improvements for you.
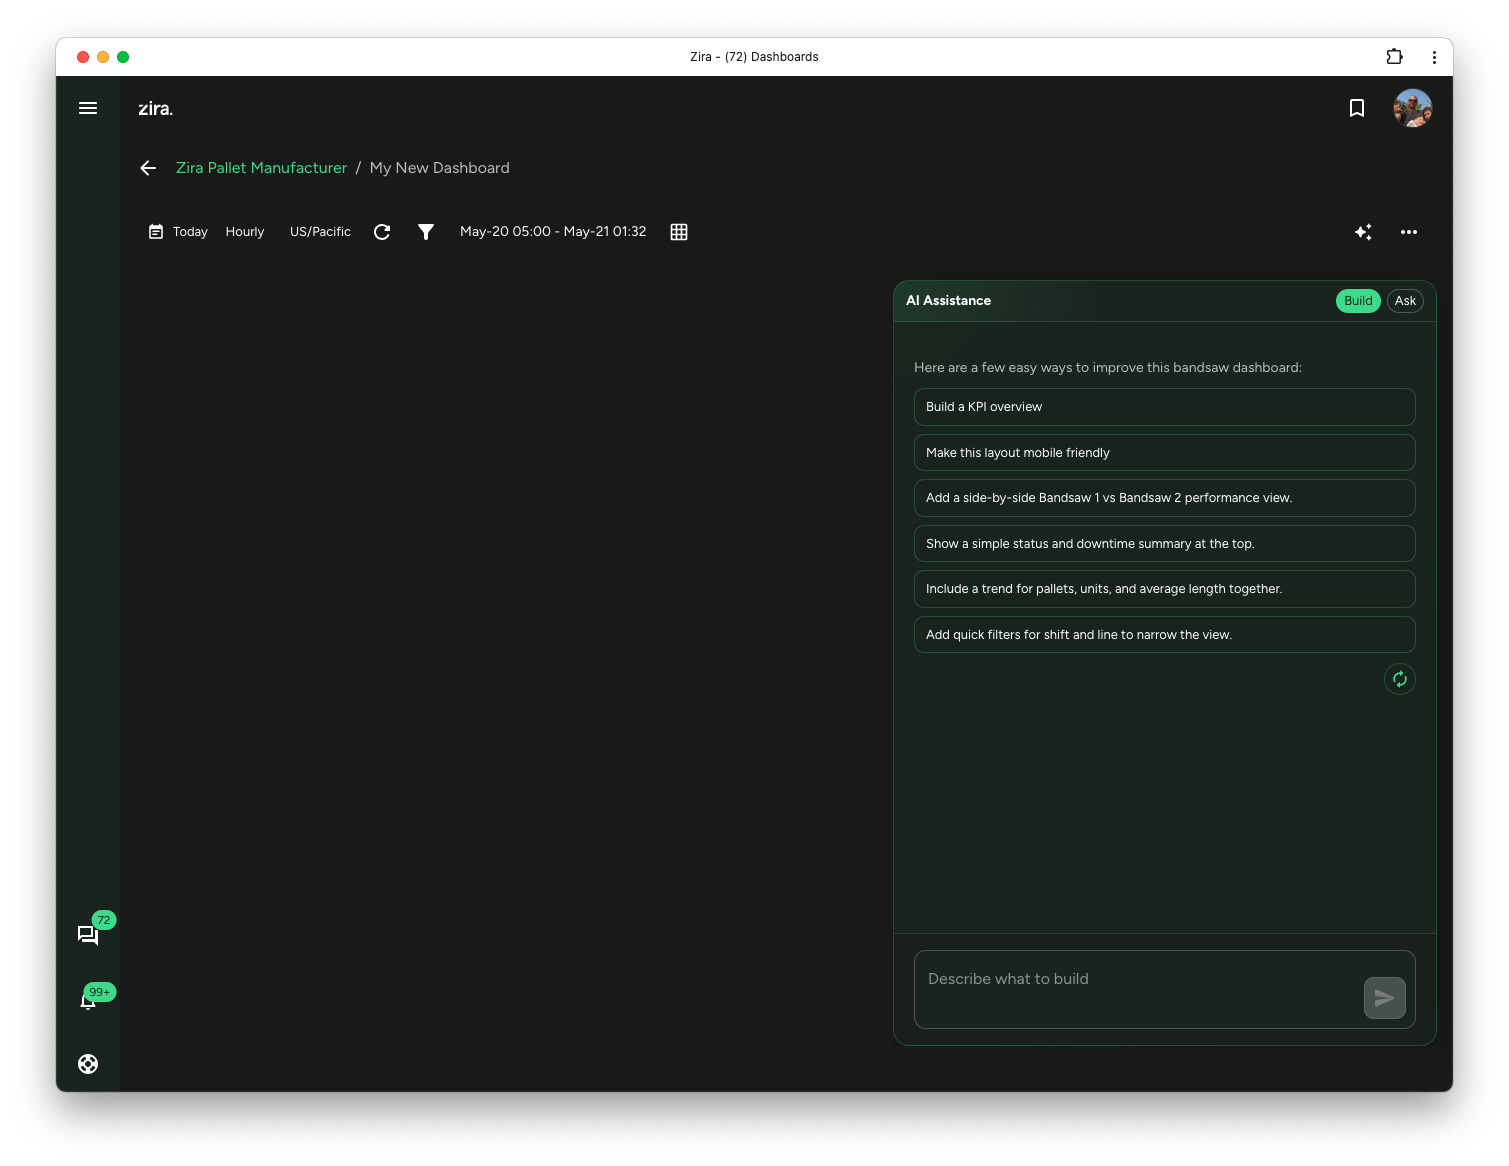
Describe what you want to build or change
You can enter a very specific request or a broad goal.
Examples:
- Build a production dashboard with a KPI, a grouped KPI by line, and a time series for output.
- Create a quality dashboard with drilldown by line then shift.
- Make me a dashboard based on the data.
- Add a side-by-side Bandsaw 1 vs Bandsaw 2 performance view.
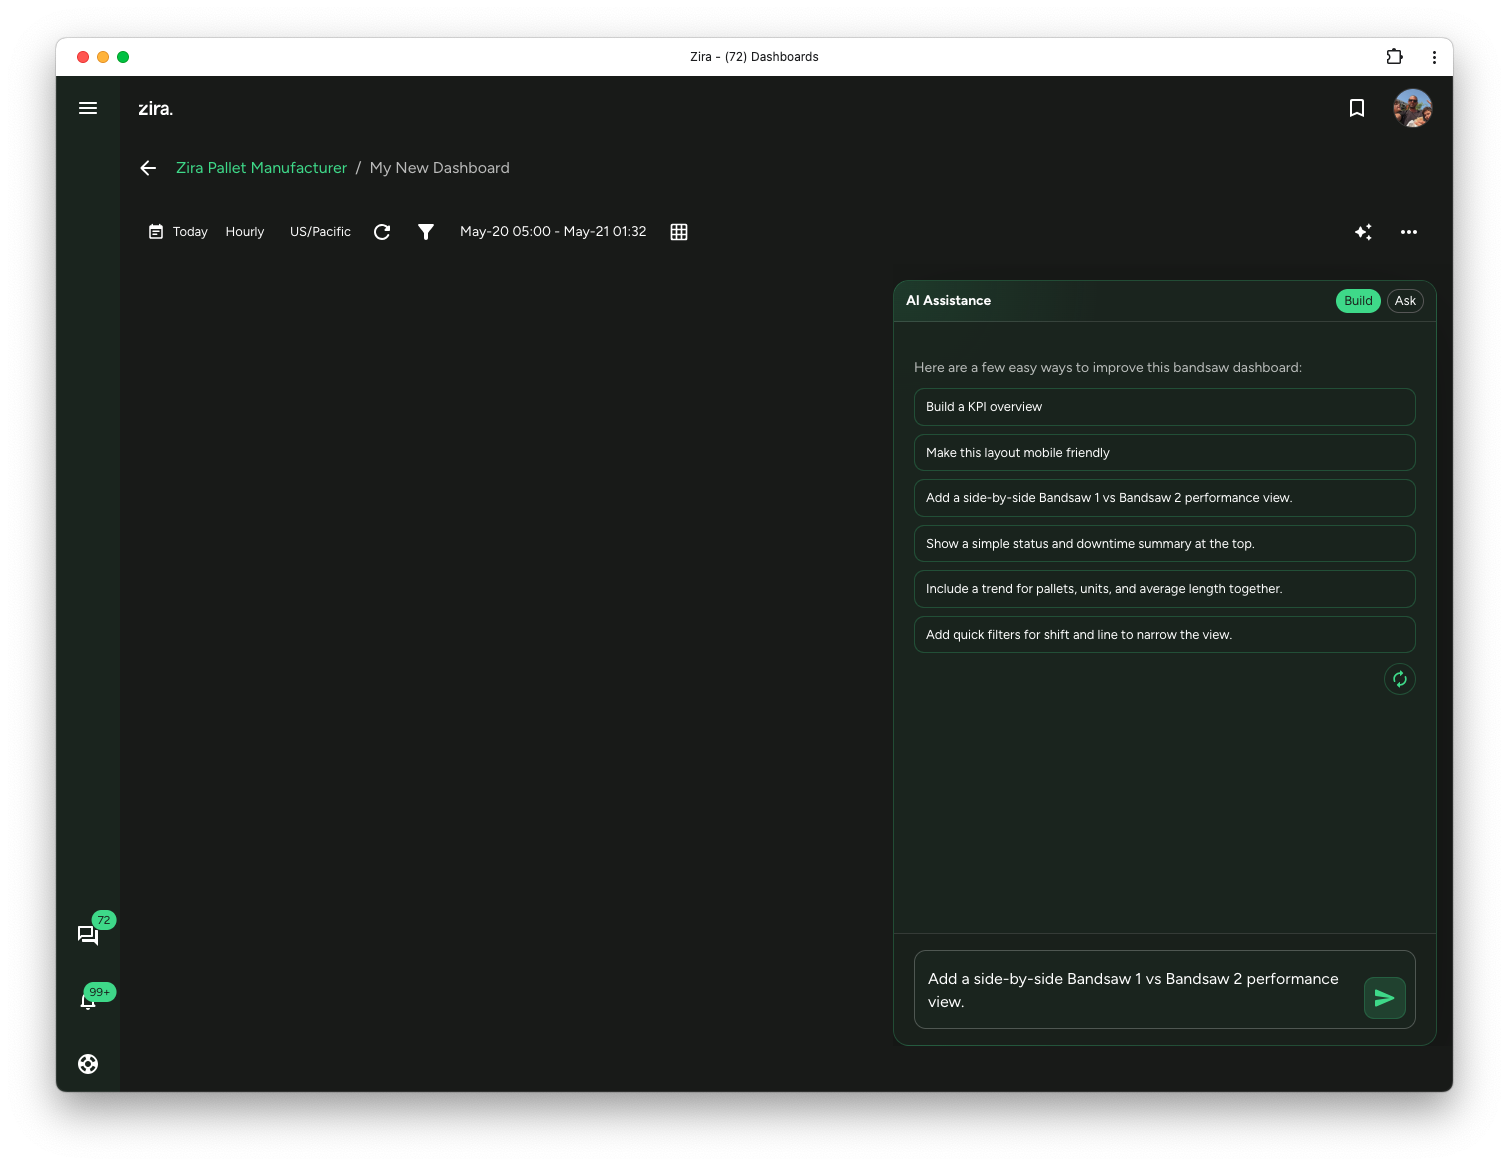
The assistant can:
- add widgets to the dashboard
- change the layout
- update the dashboard title or description
- choose Data Research widgets such as KPI, Grouped KPI, KPI Table, Column, Bar, Pie, and Time series
- add drilldown when it improves the analysis
- organize the result for desktop, tablet, and mobile
You can ask for changes such as:
- add a KPI overview
- add a side-by-side comparison widget
- change this layout to work better on mobile
- add a filter and move it to the top
- reorganize this dashboard so the most important widgets appear first
See the change before you apply it
While AI is working, the panel shows a short thinking state.
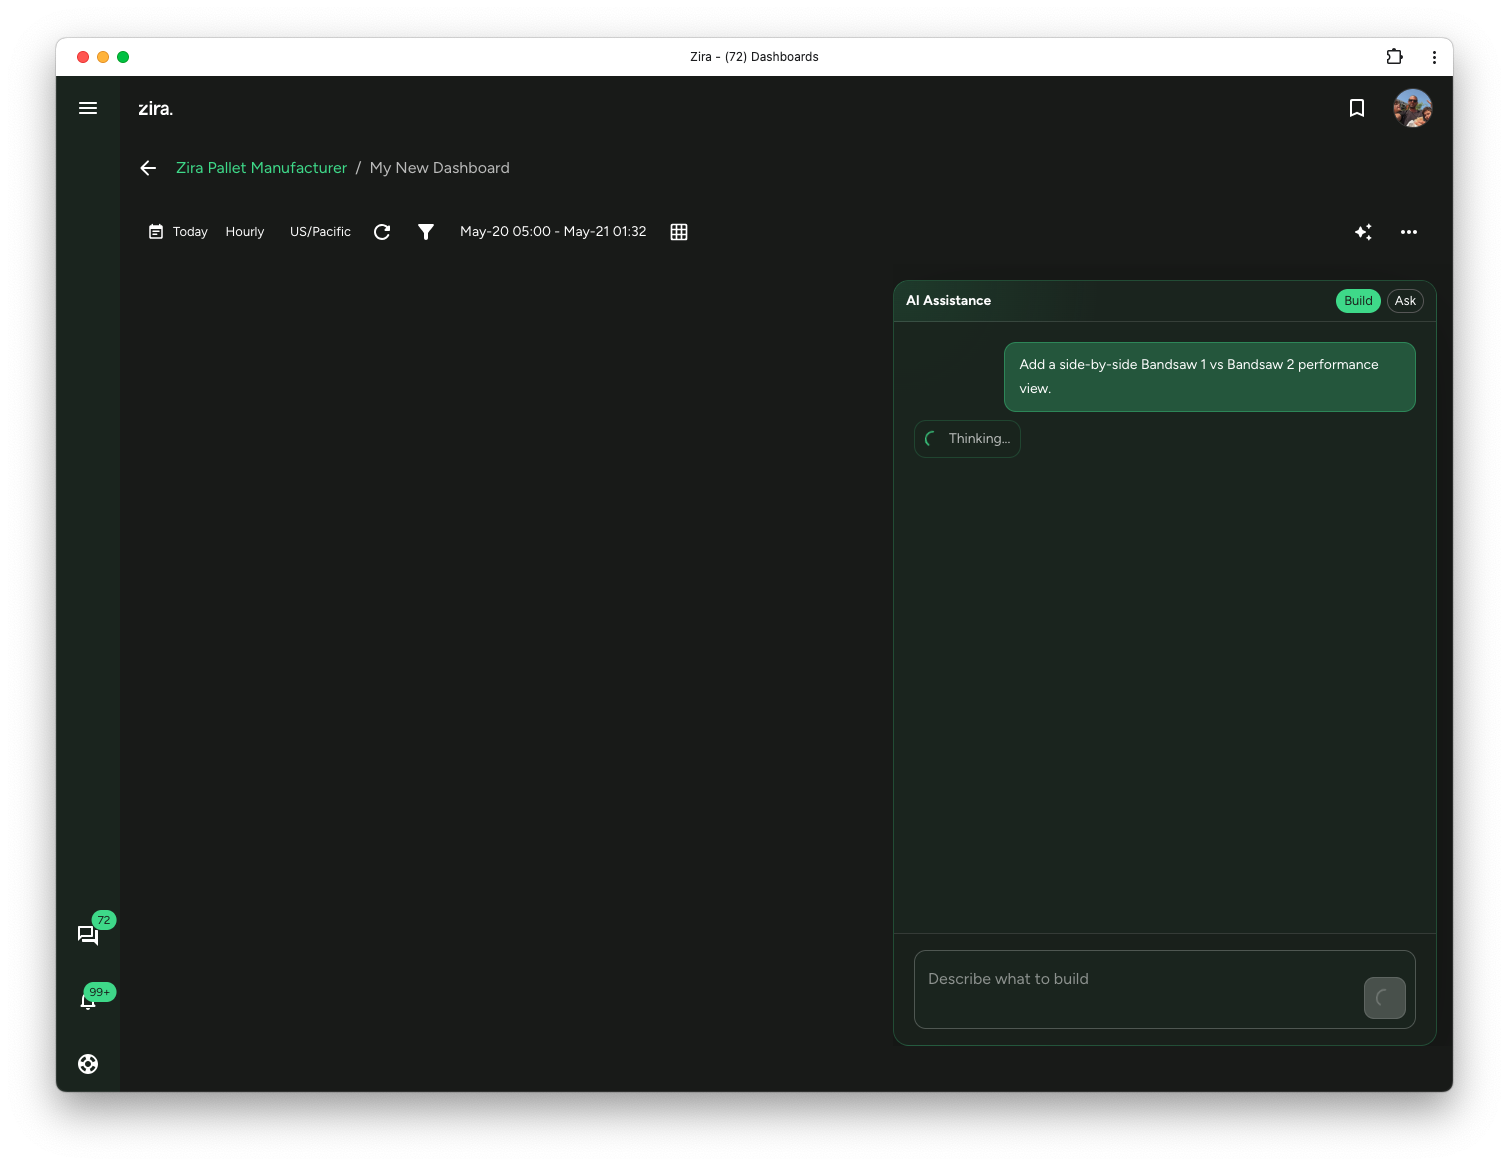
After the change is generated, review:
- the explanation of what AI changed
- the widget list
- the preview that appears on the dashboard
- the updated layout and placement
This gives you a clear view of the result before you apply it.
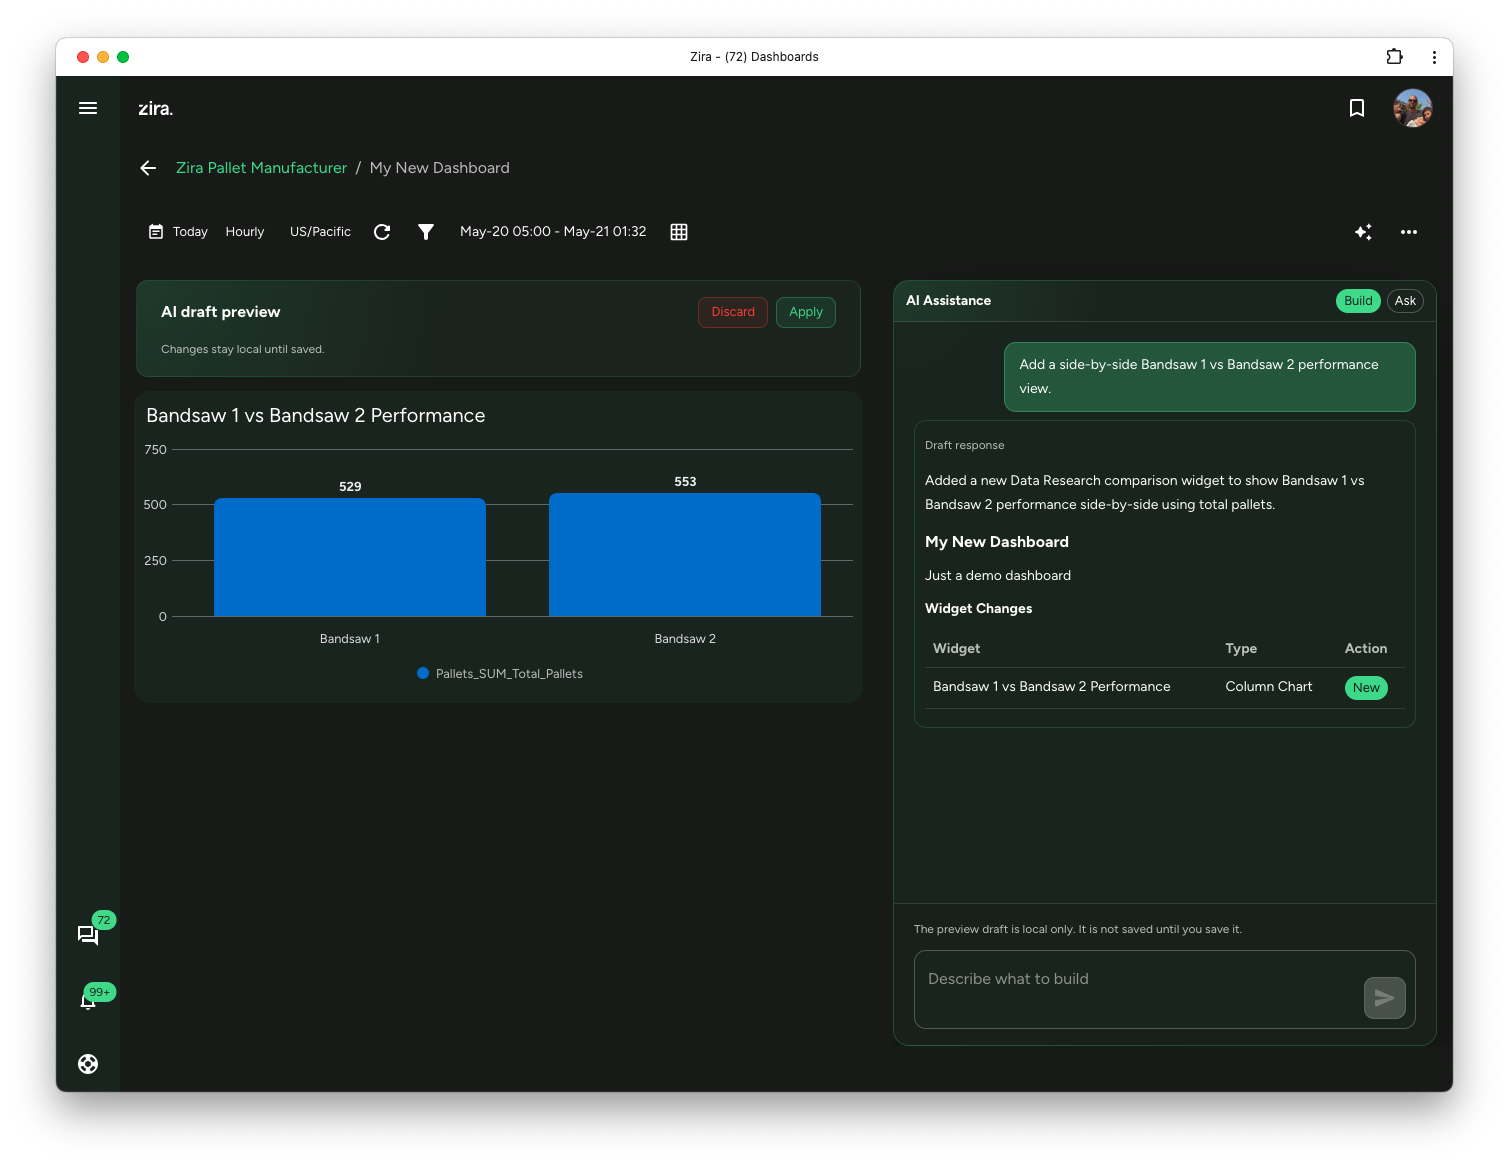
Apply the change
When the result looks right:
- Click Apply in the preview.
- Save the dashboard when you are happy with the result.
The change stays local until you apply it, so you stay in control of what goes onto the dashboard.
When drilldown is useful
Drilldown works best when the dashboard question has a natural second level.
Examples:
- line, then shift
- site, then device
- product, then sku
If the dashboard only needs a simple summary, a single grouping is usually better.
See the result on the dashboard
After you apply the change, the new widget or dashboard update appears directly on the page.
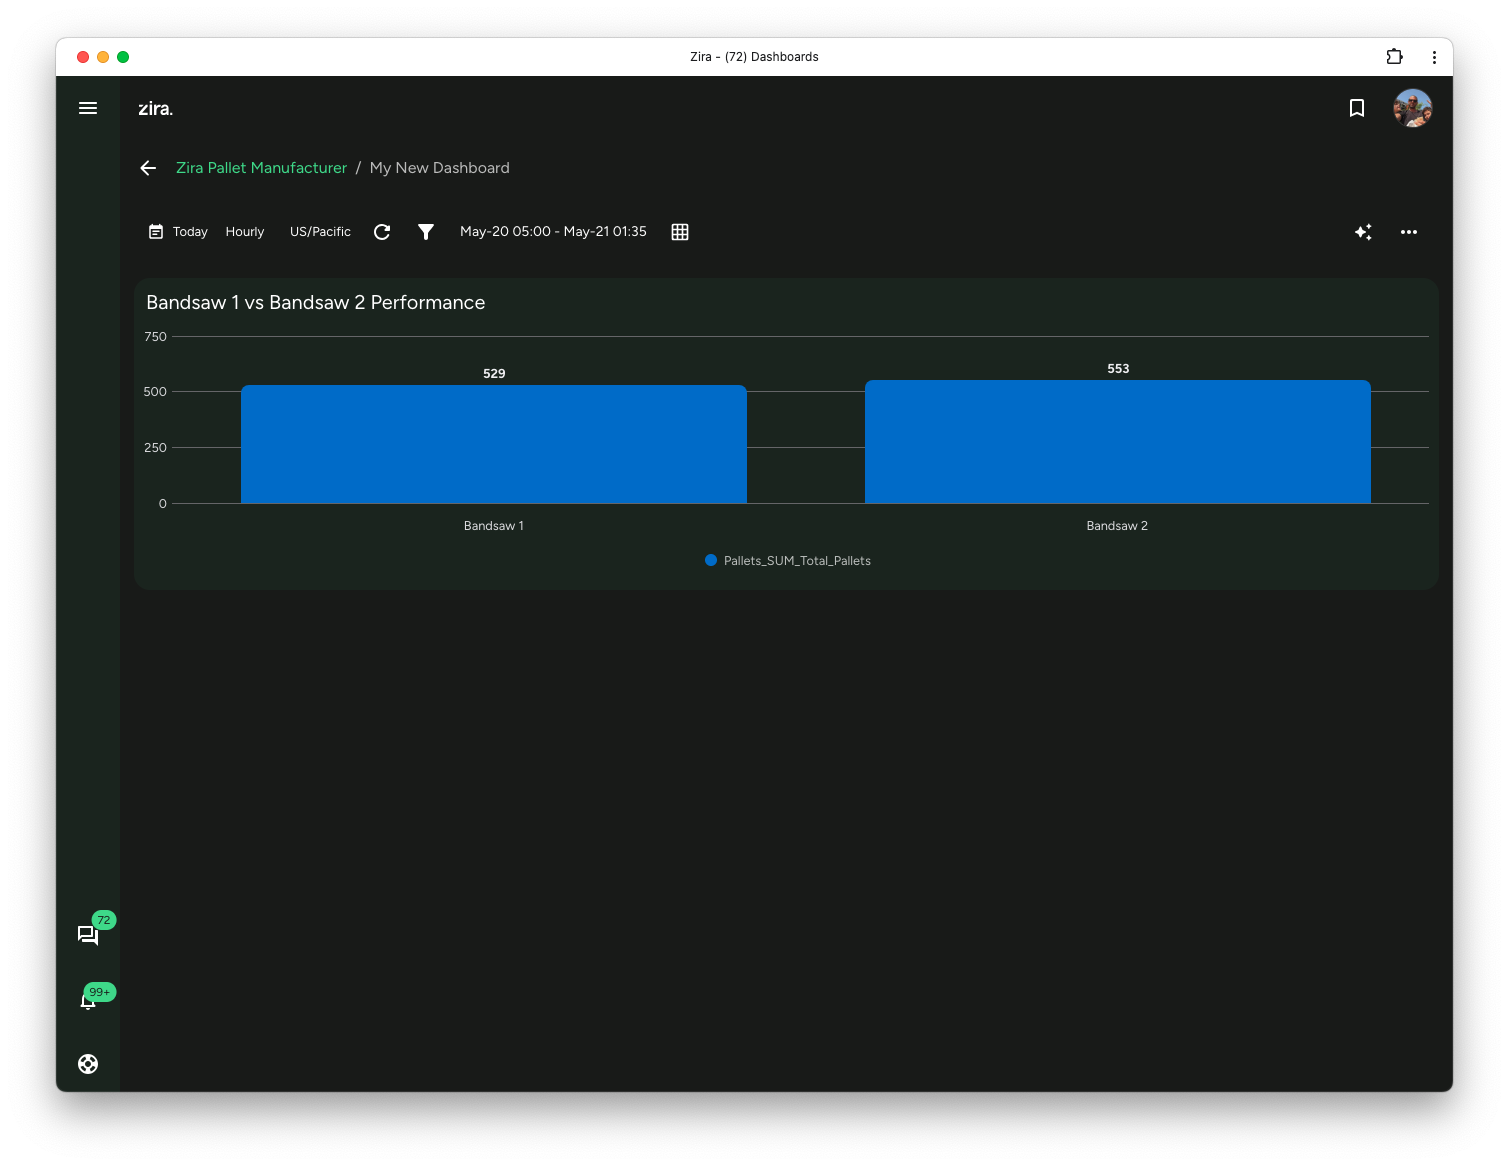
This makes AI useful both for big dashboard changes and for quick one-off updates.
Read next
- Using Dashboards - Broader dashboard workflow.
- Data Research Widgets - Refine widget setup after the change is applied.
- Layout and Editing - Adjust the layout manually after generation.